Environmental Networking Platform for Children and Youth by SAMSUNG E&A


Stay connected with Eco-generation :


| Share  |
| 
- Home >
- Our Actions >
- Ambassador report
8
Comments
2017 JEEA Report - Power Generation |
|---|
|
by Christian Gonzalez | 15-07-2017 02:17
|
|
Last February, I was able to attended the Junior Eco Engineering Academy in Seoul along with students from over a dozen countries. Part of the program included a team competition where participants were asked to design an eco-city that would satisfy certain environmental goals.
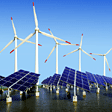
Since most of my reports have focused on problems rather than solutions, I have decided to vary this by sharing the background survey that I conducted on renewable energy for this project. The format is different from my usual reports, but I hope you will enjoy the change! Power Generation Hydropower Generating electricity from falling or running water, hydropower is the most commonly used form of renewable energy worldwide. With a global installed capacity of 1210 gigawatts in 2016, its integration in power applications currently exceeds the next four most common energy types combined by over 40%. Hydropower may be generated either by using impoundment, diversion, or pumped storage plants. Impoundment and pumped storage plants usually require the use of a dam, but facilities using the diversion technique usually have no dam controlling water flow and thus do not have means of storage integrated into the system. Depending on the applications of the plant, individual hydropower facilities may store anywhere from 100 kilowatts (KW) to 30 megawatts (MW) of power [1]. Out of these methods, pumped storage accounts for the largest amount of grid energy storage. Hydropower is a suitable renewable energy for regions of the world where there is an abundant supply of rivers, lakes, and other water bodies. Accordingly, affluent nations such as the United States and Canada are ideal locations for the implementation of hydropower as a major energy source. Where there is a lack of financial means to establish plants, specifically in developing nations in Southeast Asia and Africa, hydropower is not a pragmatic option. In terms of present regional capacity, hydropower is most suitable in North America, East Asia, Western Europe, portions of South America, and, to a lesser extent, Australia [2]. Wind Power According to the World Energy Council, global electricity demand could be met if only 1% of Earth?s land was used for wind farming. Controlled solely by the movement of air from high pressure to low pressure, wind turbines that generate electricity mechanically accounted for approximately 7% of the global power generation capacity in 2015 [3]. Wind power works by converting the airflow produced by wind to mechanical power that generators use to make electric power. This process emits no environmental pollutants that damage water sources or air, and since wind is an abundant resource that does not lessen when harvested, there are practically no limits to the extent of its applications in power where wind is present. Although many factors can influence how much power can be generated from a typical wind turbine, including geographic location and size of the turbine, the European Wind Energy Association estimates that an average onshore wind turbine yields approximately 2.5 to 3.0 MW of power annually [4]. Geographically, wind power is most suitable for East Asia, Europe, and North America. Similarly to hydropower, this energy type is not as practical for applications in Africa or Southeast Asia. Even though hydropower is largely too costly for these regions, it still outranks wind power in terms of installed capacity [5]. Solar Power Solar power can be used as a source of electricity by focusing sunlight into small beams or by using the photovoltaic effect. Systems that convert UV light into electricity typically do this through the photovoltaic effect, though concentrated solar power does still account for a small amount of solar power globally. The advantages of solar power are that both types of systems (photovoltaic cells and concentrated solar power) do not cause the release of pollutants into the air and can be run with little to no maintenance for long periods of time. Since these systems do not require human assistance to stay in working condition, they may be used in places where humans do not live. Accordingly, they do not cause any sound pollution that might result from other sources. Photovoltaic cells are used significantly more than concentrated solar power, because these systems are markedly less expensive, and do not require cooling in order to work continually. Europe leads the world in solar power use, producing over 40% of the total global capacity in 2016, followed by East Asia and North America. Solar power is more practical for use in Southeast Asia than many other renewable sources, but still only yields a small amount of energy in the region [6]. Geothermal Energy Earth?s natural heat stores can be used to generate power through geothermal energy. Thermal energy from Earth?s crust is able to be harnessed for heating and providing electricity for houses, through both liquid and vapor forms. However, geothermal energy is limited in its ability to be fully implemented in certain areas of the world, notably the Middle East and Africa. Its geographic diversity is quite low compared to sources such as solar and wind power, but its advantage is that its costs are vastly lower than most other sources of energy [Appendix B]. There are a few major disadvantages of using geothermal energy. First, its greenhouse gas emissions are higher than any other renewable energy source. It produces toxic sludge and can emit hydrogen sulfide that changes into sulfur dioxide in the atmosphere, which is harmful to human health and can lead to respiratory and cardiac diseases [7]. Biomass Energy Biomass energy is energy derived from burning organic matter from plants such as trees or other flora. This form of renewable energy is primarily generated by burning wood, but other natural resources such as grain and sugar crops are used as well. While biomass energy is beneficial because it has the potential to substantially reduce carbon dioxide emissions when compared to traditional non-renewable sources such as fossil fuels, harvesting wood from forests contributes to deforestation and can result in carbon penalties that are harmful for the environment. Since biomass energy is mainly beneficial by rural communities in developing nations, which account for 90% of its total use, it is not as practical for powering cities [8]. Criteria and Selection of Energy Source As a means to decide between which renewable energy source to use for a sustainable urban area, it is necessary to determine what factors are most important to the builders of the eco-city. The United Nations Environmental Programme (UNEP) suggests in its handbook, Sustainable Urban Energy Planning, to develop a scoring matrix to compare the performance of various energy sources and contrasting their advantages and performance in various categories such as cost and contribution to sustainability. In order to develop the most sustainable and environmentally friendly city, six goals for the energy sources of the town were decided upon and are listed below: These six factors were studied in the five main renewable energy types that were initially examined. After researching each respective factor and scaling them with respect to their determined importance during urban development, each source was ranked on a scale of 1 to 25 based on overall environmental performance, with a score of 25 being the most environmentally and economically friendly and 1 being the least practical. The results from this cost-benefit analysis determined that hydropower was the best option to power an eco-city, with wind power and geothermal energy tied for the second best source. After this, the geographic diversity potential of both wind power and geothermal energy, as determined by the Intergovernmental Panel on Climate Change in 2012, was used to determine that wind power significantly outperforms geothermal energy in terms of where it can be implemented globally. Hydropower will make up 75% of the city?s energy needs, while wind power will account for the remaining 25%. This ratio (3/1) was chosen because hydropower had three times the global installed capacity of wind power in 2016, while emitting only 1/3 the amount of CO2eq/kWh of wind power [Appendix A]. Specifically, hydropower will come from pumped storage plants, as it is the largest form of grid energy storage in the world currently [9]. The remaining 25% of energy from wind power will be made up by 90% horizontal axis wind turbines (HAWT) on the outskirts of the city and 10% from twisted savonius wind turbines that will be incorporated into the city streets to capture wind in between buildings that other turbines have difficulty doing [10]. Twisted savonius wind turbines were chosen to account for less percentage of the city?s energy supplies because, while they are more reliable due to their vertical axis design and do not need to face the direction of the wind to generate electricity, they typically generate less energy when compared to HAWT. However, they will still be used because they have the potential to capture wind power between city buildings that other designs are unable to do [Appendix C]. Figure 1. The eco-city will be powered by 75% pumped storage hydropower plants outside of city limits, 22.5% horizontal axis wind turbines on the outskirts of the city, and 2.5% twisted savonius wind turbines integrated into the streets of the city that capture wind between buildings. Bibliography 1. https://energy.gov/eere/water/types-hydropower-plants 2.http://earth.rice.edu/mtpe/geo/geosphere/hot/energyfuture/hydroelectricity.html 3. https://www.worldenergy.org/data/resources/resource/wind/ 4. http://www.ewea.org/wind-energy-basics/faq/ 5. https://www.worldenergy.org/publications/2016/world-energy-resources-2016/ 6. https://www.worldenergy.org/data/resources/resource/solar/ 8. https://www.worldenergy.org/data/resources/resource/biomass/ 9. http://www.economist.com/node/21548495?frsc=dg%7Ca 10. http://celloexpressions.com/ts/dynamic-documentation/intro/Appendix A Graphical Data Figure 2. Comparison of the amount of CO2eq per kilowatt-hour released for each renewable energy source that was contemplated. This graph uses data from each source?s 50th percentile emissions as calculated by the IPPC in 2012. EMISSIONS (lowest to highest) 1. Hydropower (4 CO2e / kWh) - 5 Points 2. Wind Power (12 CO2e / kWh) - 4 Points 3. Biomass Energy (18 CO2e / kWh) - 3 Points 4. Solar Power (22 CO2e / kWh) - 2 Points 5. Geothermal Energy (45 CO2e/ kWh) - 1 Point Year: 2012 (Statistics from Intergovernmental Panel on Climate Change) https://www.ipcc.ch/pdf/special-reports/srren/SRREN_FD_SPM_final.pdf Figure 3. Global installed capacity of contemplated energy sources (GW = gigawatts) as calculated by the World Energy Council in 2016. CAPACITY (highest to lowest) 1. Hydropower (1210 GW / annually) - 5 Points 2. Wind Power (432 GW / annually) - 4 Points 3. Solar Power (227 GW / annually) - 3 Points 4. Biomass Energy (106 / annually) - 2 Points 5. Geothermal Energy (83.4 GW / annually) - 1 Point Year: 2016 (Statistics from World Energy Council) https://www.worldenergy.org/publications/2016/world-energy-resources-2016/ Figure 4. Estimated levelized energy cost by source per plant in 2022 ($ = 2015 USD) as calculated by the U.S. Energy Information Administration. COST (lowest to highest) 1. Geothermal Energy ($45.00 / kWh) - 5 Points 2. Wind Power ($64.50 / kWh) - 4 Points 3. Hydropower ($67.80 / kWh) - 3 Points 4. Solar Power ($84.70 / kWh) - 2 Points 5. Biomass Energy ($96.10 / kWh) - 1 Point Year: 2022 (Statistics from U.S. Energy Information Administration) http://www.eia.gov/outlooks/aeo/pdf/electricity_generation.pdf SCORING METHOD
SOURCES
Appendix B Cost-Benefit Analysis Data Hydropower Levelized Energy Cost: $67.80 / kWh Setup Costs: $1000 - $3500 / kW Operational and Maintenance Costs: 1% - 4% / kW Incidental Costs: Disruption of fish migration Waste Produced: No direct waste produced Environmental Benefits: Low CO2 emissions Regions Suitable For: North America, East Asia, Western Europe, South America https://www.irena.org/documentdownloads/publications/re_technologies_cost_analysis-hydropower.pdf Wind Power Levelized Energy Cost: $64.50 / kWh Setup Costs: $4000 - $4500 / kW Operational and Maintenance Costs: 3% / kW Incidental Costs: Noise pollution Waste Produced: No direct waste produced Environmental Benefits: Low CO2 emissions Regions Suitable For: East Asia, Europe, North America https://www.irena.org/documentDownloads/Publications/RE_Technologies_Cost_Analysis-WIND_POWER.pdf http://www.windmeasurementinternational.com/wind-turbines/om-turbines.php Solar Power Levelized Energy Cost: $84.70 / kWh Setup Costs: $3600 - $5800 / kW Operational and Maintenance Costs: 0.5% - 1% / kW Incidental Costs: Noise and visual pollution Waste Produced: No direct waste produced Environmental Benefits: Low CO2 emissions Regions Suitable For: Europe, East Asia, North America, anywhere in the tropics https://www.irena.org/documentDownloads/Publications/RE_Technologies_Cost_Analysis-SOLAR_PV.pdf Geothermal Energy Levelized Energy Cost: $45.00 / kWh Setup Costs: $1850 - $5100 / kW Operational and Maintenance Costs: Insubstantial ($0.01 - $0.03 / kWh) Incidental Costs: Damage to human respiratory and cardiac health Waste Produced: Ammonia, boron, hydrogen sulfide, and methane Environmental Benefits: Low CO2 emissions Regions Suitable For: Europe, North America, Southeast Asia, and portions of South America and East Africa https://energy.gov/eere/geothermal/geothermal-faqs#cost_to_develop_geothermal_power_plant Biomass Energy Levelized Energy Cost: $96.10 / kWh Setup Costs:$140 - $4260 / kW Operational and Maintenance Costs: 2% - 6% / kW Incidental Costs: Deforestation and carbon penalties Waste Produced: Methane and wood waste Environmental Benefits: Helpful in landfill reduction, low CO2 emissions Regions Suitable For: North America, South America, Europe, and portions of East Asia https://www.irena.org/documentDownloads/Publications/RE_Technologies_Cost_Analysis-BIOMASS.pdf https://www.irena.org/documentDownloads/Publications/IRENA_RE_Power_Costs_2014_report.pdf |

|
|
|
|
|


 Previous : RPTRA


8 Comments
thanks for sharing
Posted 06-02-2018 21:18
good report
Posted 06-02-2018 21:18
Nice report Christian Gonzalez. Thanks for sharing it with us :)
Posted 25-07-2017 19:42
Thanks so much Christian for sharing your well researched and laid out report substantiated with data, analysis, achievable goals and details of clean energy sources. I was fortunate enough to be a part of JEEA and get the information first hand through the workshop and presentations.
Posted 21-07-2017 23:07
Christian, I am sure you must have had a wonderful and enriching experience in designing an eco city in Junior Eco Engineering Academy in Seoul. You have excellently projected the performance of various energy sources in terms of its advantages and performance in categories of cost and contribution to sustainability.Thanks for sharing such an extensive and informative report.
Posted 21-07-2017 00:48
Christian, thank you for your report. Although it is a difficult and challenging work, designing an eco-city is a worthy try. I hope you enjoyed it! Lots of information and well organized. Good job! I also hope you had a good time in Seoul!
Posted 21-07-2017 00:16
Hi Christian! Thanks for sharing your research with us:)
Your report was really well written, helping me understand different sources of renewable energies and their characteristics. Hope you enjoyed your e-gen academy and staying in Seoul!
Posted 16-07-2017 00:02
Thanks for quite an informative report Christian. It's knowledge enriching to read criteria, goals and potential of different clean energy sources.
Posted 15-07-2017 06:16